STUDY 1, PHASE 3 STUDY
Demonstrated improvement vs placebo in esophageal inflammation and dysphagia relief1,2
Histological Remission (≤6 eos/hpf)
Greater proportion of patients achieved histological remission with EOHILIA vs placebo after 12 weeks1
Mean (SD) peak eosinophil counts at baseline were 74.5 (39.2) eos/hpf and 76.6 (45.0) eos/hpf in the EOHILIA and placebo groups, respectively.2
DSQ Combined Score
Greater reduction with EOHILIA vs placebo in absolute change from baseline in DSQ combined score (0-84†), LS mean (SE) after 12 weeks1
Mean (SD) DSQ combined scores at baseline were 30.3 (13.9) and 30.4 (13.1) in the EOHILIA vs placebo groups, respectively.1
*For histological remission, the difference in percentages and 95% Newcombe confidence intervals are estimated using Mantel Haenszel weights, adjusting for age group and diet restriction.1
†Total biweekly DSQ scores range from 0 to 84; higher scores indicate greater frequency and severity of dysphagia.1
‡For absolute change in DSQ score, the LS mean changes, standard errors, and differences are estimated using an ANCOVA model with treatment group, age group, diet restriction, and baseline measurement as covariates.1
CI=confidence interval; LS=least squares; SE=standard errors.
STUDY 2, PHASE 2 STUDY
Demonstrated improvement vs placebo in esophageal Inflammation and dysphagia relief1,4
Histological Remission (≤6 eos/hpf)
Greater proportion of patients achieved histological
remission with EOHILIA vs placebo after 12 weeks1
Mean (SD) peak eosinophil counts at baseline were 158.9 (96.7) eos/hpf and 133.0 (81.6) eos/hpf in the EOHILIA and placebo groups, respectively.5
DSQ Combined Score
Greater reduction with EOHILIA vs placebo in absolute change from baseline in DSQ combined score (0-84†), LS mean (SE) after 12 weeks1
Mean (SD) DSQ combined scores at baseline were 30.7 (16.0) and 29.0 (13.5) in the EOHILIA vs placebo groups, respectively.1
ADDITIONAL STUDY
After completing Study 1, 48 subjects from the EOHILIA 2 mg treatment arm entered a double-blind, randomized withdrawal extension study and received EOHILIA 2 mg twice daily or placebo for up to an additional 36 weeks.1
There was no statistically significant difference between the EOHILIA group and those re-randomized to the placebo group for prespecified efficacy endpoints based on eosinophil count and/or clinical symptoms measured by the DSQ at week 36.1
STUDY 1 AND STUDY 2 SECONDARY ENDPOINTS
Proportion of histological responders with a peak eosinophil count of ≤15 eos/hpf or ≤1 eos/hpf at week 122,5
Study 1
Study 1
In Study 2, the proportion of histological responders post treatment in the EOHILIA group (n=48) vs the placebo group (n=38) who had a peak eosinophil count ≤15 eos/hpf was 48% vs 8%, respectively, and the proportion with ≤1 eos/hpf was 31% vs 0%, respectively.5
Data Limitations: The prespecified secondary endpoints shown above were not powered to determine treatment effect and appropriate multiplicity adjustments were not applied. The results need cautious interpretation and could represent chance findings.
STUDY 1 AND STUDY 2 SECONDARY ENDPOINTS
LS mean (SEM) change in total EREFS from baseline
to week 122,5
Study 1
Baseline mean (SD) EREFS was 7.6 (3.6) in the EOHILIA group and 8.2 (3.3) in the placebo group.2
Study 2
Baseline mean (SD) EREFS was 7.8 (3.57) in the EOHILIA group and 7.0 (3.31) in the placebo group.5
SEM=standard error of the mean.
Data Limitations: The prespecified secondary endpoint shown above was not powered to determine treatment effect and appropriate multiplicity adjustments were not applied. The results need cautious interpretation and could represent chance findings. Thresholds for clinically meaningful changes in EREFS have not been established.
References:
- EOHILIA (budesonide oral suspension) Prescribing Information. Takeda Pharmaceuticals, Inc.
- Hirano I, Collins MH, Katzka DA, et al. Clin Gastroenterol Hepatol. 2022;20(3):525-534.e10.
- Hudgens S, Evans C, Phillips E, et al. J Patient Rep Outcomes. 2017;1(1):3.
- Dellon ES, Katzka DA, Collins MH, et al. Gastroenterology. 2017;152(4):776-786.e5.
- Data on file, Takeda Pharmaceuticals, Inc.
- Hirano I, Furuta GT. Gastroenterology. 2020;158(4):840-851.
- Lucendo AJ, Molina-Infante J, Arias A, et al. United European Gastroenterol J. 2017;5(3):335-358.
- Dellon ES, Liacouras CA, Molina-Infante J, et al. Gastroenterology. 2018;155(4):1022-1033.e10.
- National Library of Medicine. National Institutes of Health. Memon RJ, Savliwala MN. Eosinophilic gastroenteritis. ©2024, StatPearls Publishing LLC. Figure contributed by Michael Bonert. Last updated: June 26, 2023. Accessed May 28, 2024. https://www.ncbi.nlm.nih.gov/books/NBK547729/.
- Hirano I, Moy N, Heckman MG, et al. Gut. 2013;62(4):489-495.
- Vračarić V, Savić Ž, Živojinov M, et al. Vojnosanit Pregl. 2017;74(1):64-68.
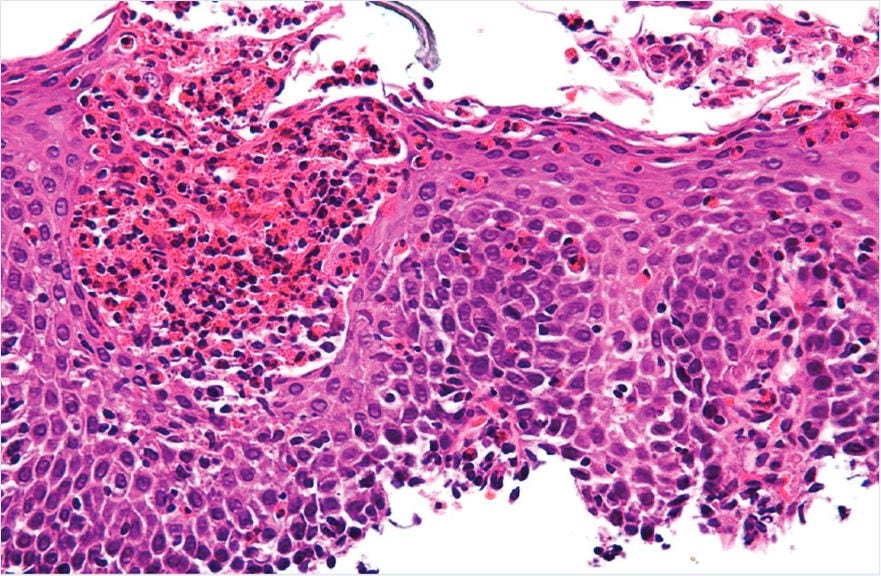
Histological response is used to assess EoE treatment response6
Eosinophilic inflammation in the esophageal mucosa is the hallmark observation from which EoE derives its name.7

Diagnostic guidelines for EoE state multiple endoscopic biopsies from at least 2 esophageal levels are recommended, and a diagnosis of EoE requires ≥15 eosinophils/hpf on biopsy.7,8
Copyright ©2011 Michael Bonert. National Library of Medicine. National Institutes of Health. Eosinophilic gastroenteritis. (https://commons.wikimedia.org/wiki/User:Nephron). Image free to share and adapt per CC BY-SA 3.0. (https://creativecommons.org/licenses/by-sa/3.0/legalcode).9
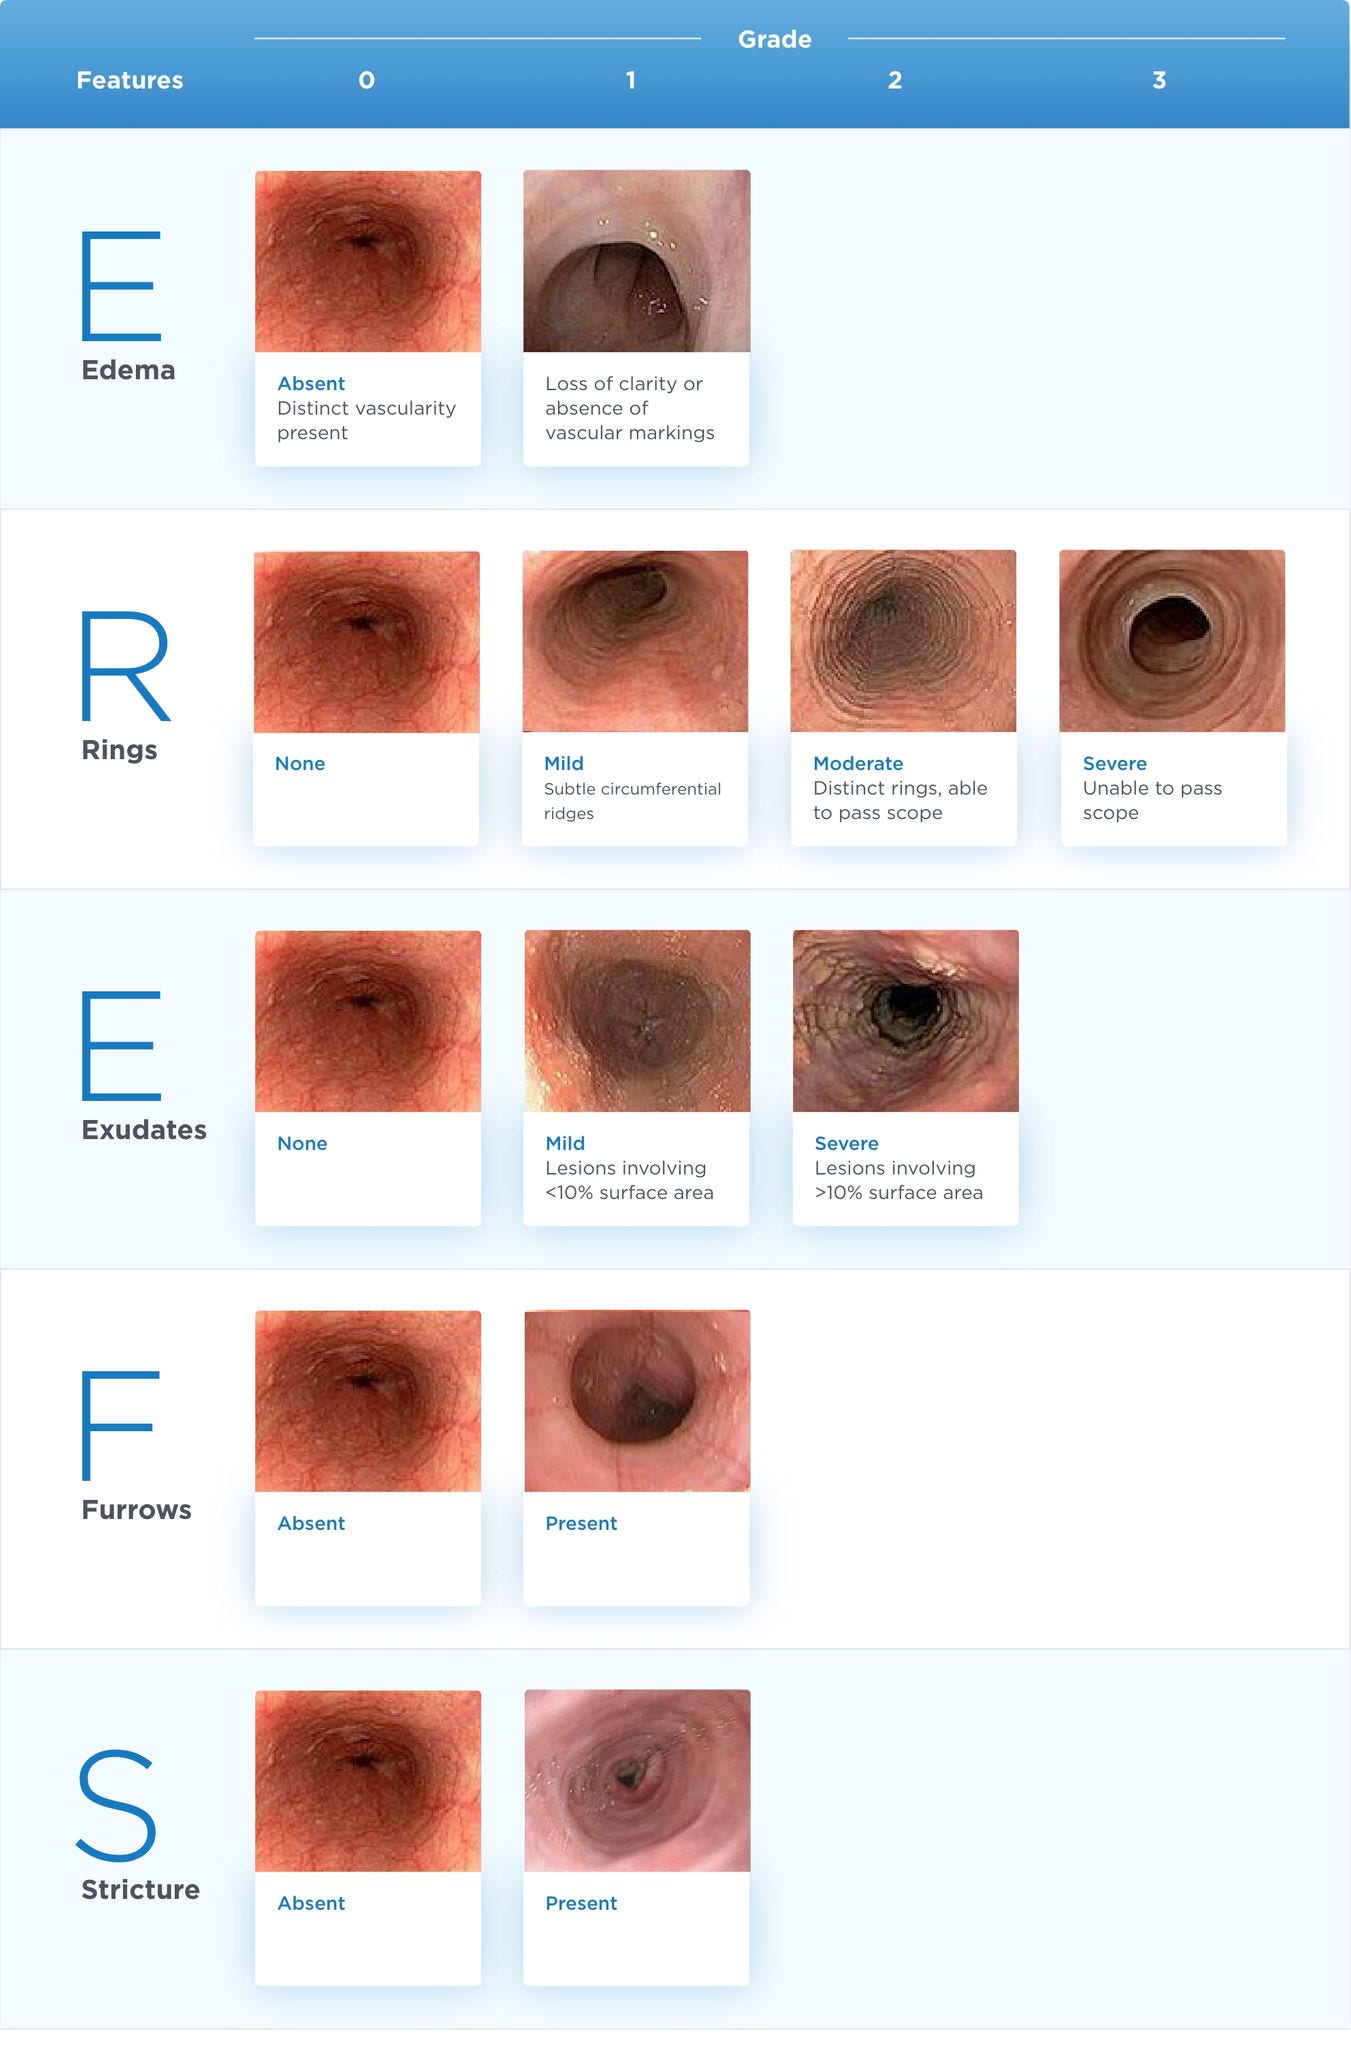
EoE Endoscopic Reference Score (EREFS)10,11
Thresholds for clinically meaningful changes in the EoE-EREFS have not been established.

Adapted from Hirano I, Moy N, Heckman MG, et al. Gut. 2013;62(4):489-495 and Vračarić V, Savić Ž, Živojinov M, et al. Vojnosanit Pregl. 2017;74(1):64-68.
This is not a diagnostic tool and is provided for informational purposes only.
Note: This is the updated and latest version of the EREFS; an earlier version (V1) was used in the EOHILIA clinical studies.
In EOHILIA clinical studies, the total EREFS was calculated by summing the severity scores of the individual components of the EREFS assessed for both the proximal and distal esophagus and ranged from 0-20, with higher scores indicating more severe endoscopic findings.4
The Dysphagia Symptom Questionnaire (DSQ) was developed specifically to measure dysphagia associated with EoE3
The DSQ (version 4.0) and score for each response option3,a
| Question | |
1.Since you woke up this morning, did you eat solid food?b | |
| Patient Response | Score |
| No | |
| Yes | |
2.Since you woke up this morning, has food gone down slowly or been stuck in your throat? | |
| Patient Response | Score |
| No | 0 |
| Yes | 2 |
3.For the most difficult time you had swallowing food today (during the past 24 hours), did you have to do anything to make the food go down or to get relief? | |
| Patient Response | Score |
| No, it got better or cleared up on its own | 0 |
| Yes, I had to drink liquid to get relief | 1 |
| Yes, I had to cough and/or gag to get relief | 2 |
| Yes, I had to vomit to get relief | 3 |
| Yes, I had to seek medical attention to get relief | 4 |
4.The following question concerns the amount of pain you have experienced when swallowing food. What was the worst pain you had while swallowing food over the past 24 hours?c | |
| Patient Response | Score |
| None, I had no pain | 0 |
| Mild | 1 |
| Moderate | 2 |
| Severe | 3 |
| Very Severe | 4 |
Question | Patient Response Options | Score |
1.Since you woke up this morning, did you eat solid food?b | No | |
| Yes | ||
2.Since you woke up this morning, has food gone down slowly or been stuck in your throat? | No | 0 |
| Yes | 2 | |
3.For the most difficult time you had swallowing food today (during the past 24 hours), did you have to do anything to make the food go down or to get relief? | No, it got better or cleared up on its own | 0 |
| Yes, I had to drink liquid to get relief | 1 | |
| Yes, I had to cough and/or gag to get relief | 2 | |
| Yes, I had to vomit to get relief | 3 | |
| Yes, I had to seek medical attention to get relief | 4 | |
4.The following question concerns the amount of pain you have experienced when swallowing food. What was the worst pain you had while swallowing food over the past 24 hours?c | None, I had no pain | 0 |
| Mild | 1 | |
| Moderate | 2 | |
| Severe | 3 | |
| Very Severe | 4 | |
Adapted with permission from Hudgens S, Evans C, Phillips E, et al. J Patient Rep Outcomes. 2017;1(1):3.
aThe scoring algorithm was constructed from responses to questions 2 and 3, to ensure that the final DSQ score was driven by the frequency and severity of dysphagia.
bResponses to question 1 were unscored.
cResponses to question 4 were not included as part of the psychometric analysis; question 4 is a standalone item on the DSQ.
This questionnaire is provided for informational purposes only in order to show the questions that were asked as part of the DSQ evaluation in the EOHILIA clinical trials. This is not a diagnostic tool.
DSQ 14-day combined score4
In the studies, the DSQ score was calculated by adding the answers to questions 2 and 3, multiplying them by 14 (days), and dividing them by the number of days with no missing responses.
• 14-day scores can range from 0-84
